HAIvia Dashboard
 |
The HAIvia BottomlineEfficiently access information that reduces HAIs and ultimately saves lives. Fewer HAIs leads to lower malpractice risk, lower reimbursement penalties, and higher cost savings. Visit Why HAIvia for more. HAIvia OverviewWith HAIvia make informed decisions to lower healthcare-associated infection (HAI) rates, better train environmental services personnel and manage facilities, and increase revenue. The HAIvia family of products captures and integrates your business information such as inspection reports, employee performance, inventory, and facilities management with data from the Centers for Medicare and Medicaid Services (CMS) to create a visual infection prevention Dashboard. The environmental services world is full of overwhelming data from both governmental and internal sources. HAIvia Dashboard efficiently decodes this information for optimal infection prevention and patient safety by managing and analyzing the cleaning environment. Infection prevention decision support has never been easier. "HAIvia" ExplainedWe borrowed the HAI (healthcare-associated infections) term and combined it with "via" for "visual analysis" as HAIvia presents critical decision support information visually allowing healthcare and environmental services personnel to easily and quickly analyze data and spot trends for the best possible patient outcomes and cost savings. |
Monitor, Manage and Analyze your Environment with HAIvia
 |
 |
 |
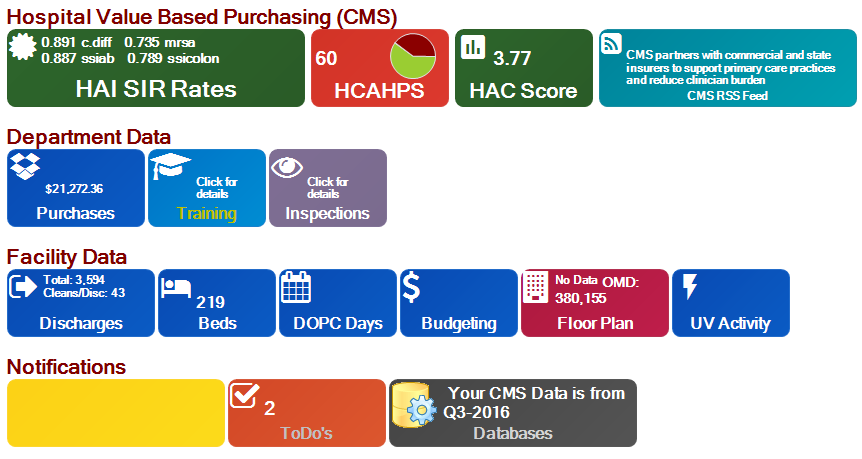
| See your facilities HAI rates, and HAC and HCAHPS scores. With human resource integration, view the training status and CDC inspection audits of your cleaning professionals. With integrated housekeeper task and space management, see task lists and utilization rates at a glance. |
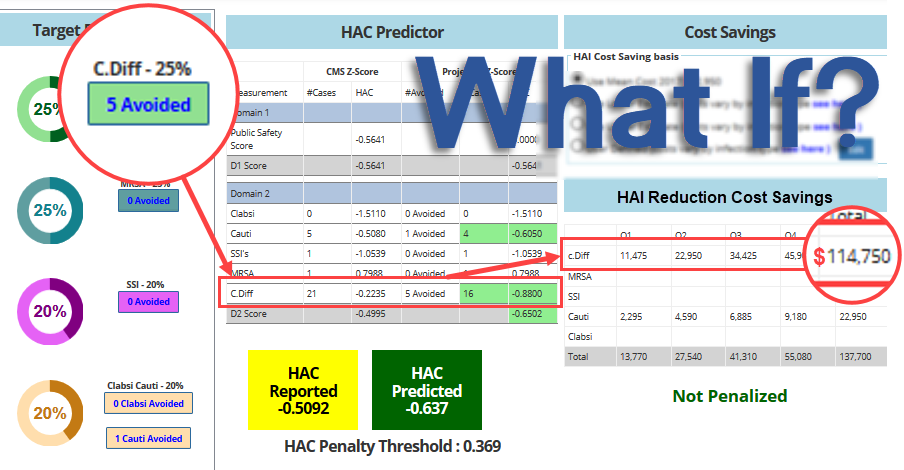
Set your own specific thresholds for HAI rates, quality inspections and more and quickly spot issues with color-coded warnings. Compare your facility to system level performance. Calculate your savings by using HAIvia’ s infection reduction ROI cost savings calculator. |
Spot trends in infection patterns, manage housekeeper tasks, and assign staff to training for corrective action for improved infection prevention and reimbursements. With better facilities and inventory monitoring, experience increased efficiencies. |


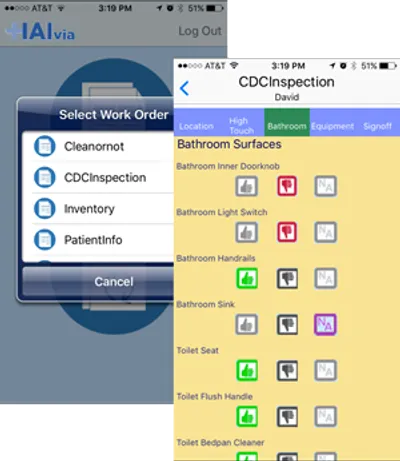 HAIvia Mobile can save time, reduce costs, and eliminate paper and data entry errors by automating task-related forms and reporting. Combining HAIvia Mobile with HAIvia Dashboard offers detailed analysis of the data providing actionable information to help in your fight against healthcare-associated infections (HAIs) and increase your Medicare Value-Based Purchasing incentive payments and insurance reimbursements. HAIvia Mobile practically eliminates the need for application training by using a familiar touchscreen interface with a variety of data entry tools. Use standard CDC inspection forms or design your own, enabling the capture of data most valuable to your organization in the fight against Hospital Acquired Conditions (HACs).