Modelling Savings with the ROI Calculator
Graphing CMS SIR Numbers for Comparison
Review select hospitals’ CMS rates and scores for C.diff., MRSA, SSAColon, and more. Any company internal performance metrics can be integrated as well and shown graphically over time. Select a tile to easily drill down for more detailed analysis. Compare how a single hospital unit performs against the hospital system as a whole or by region or hierarchy.
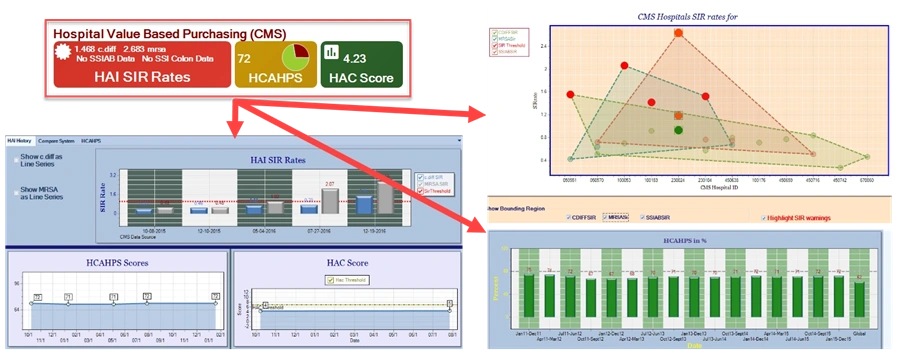
Illustration: Key Performance Indicator information can be presented in various chart formats. Format can be customized by DocuFi to your specifications: bar, pie, scatter, etc.
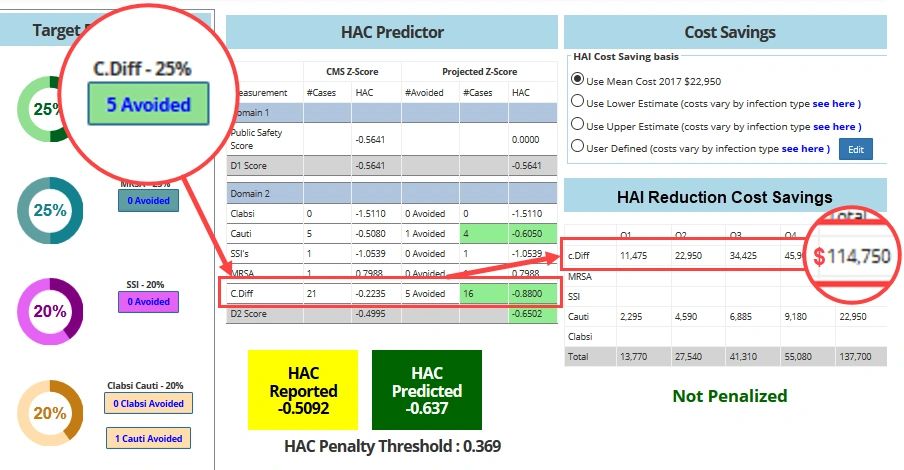
Model Savings with the ROI Calculator
Use the HAIvia ROI tool to identify potential savings from reducing your infections. Dynamically explore “what if” scenarios using your facilities’ actual data and known reduction targets.
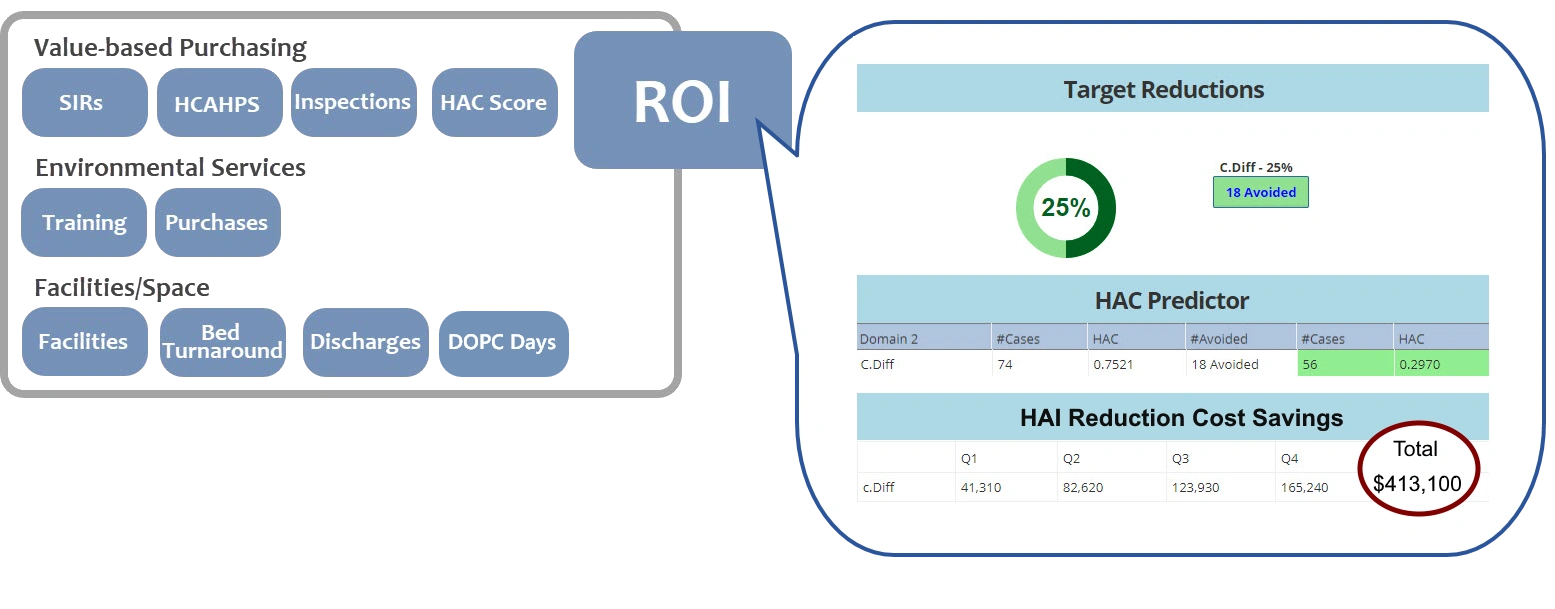
To evaluate potential savings, users select a hospital and then the infection they’d like to improve in the Target Reduction panel on the left. Simply move the dial to model the infection target. See the potential reduction in the number of cases and the improved HAC score. Most importantly, dynamically see costs savings that may be attributed to the fewer infections in the HAI Reduction Cost Savings panel. Play with different algorithms from conservative to aggressive in the Cost Savings Basis panel.